

This Lamacchia Mid-Year Housing Report presents overall home sale statistics as of the first six months of 2023 compared to the same period last year, January 1st to June 30th, 2022. Highlighted in this report are the average sale prices for single-family, condominiums, and multi-family homes in Massachusetts along with the number of homes listed for sale, placed under contract, and price adjustments.
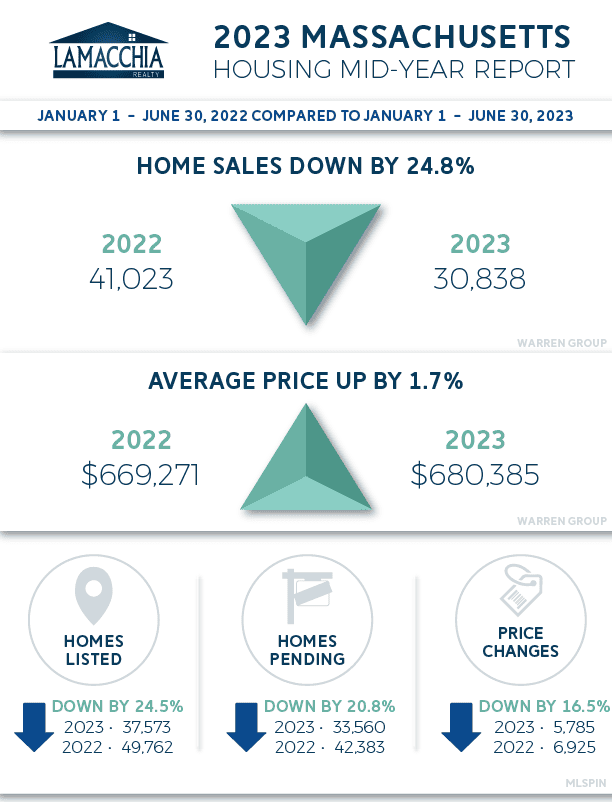
Number of Homes Sold Decreased by 24.8%
Home sales for single families, condos and multi-families decreased with 30,838 closing in the first half of 2023 compared to 41,023 in the first half of 2022.
- The number of sales decreased in all three categories: down by 24.2% for singles, 23.2% for condos, and by 33.8% for multi-families.
- Sales are down now due to major mortgage rate increases crushing buyer affordability, and sellers hesitating to list their homes because they don’t want to lose their low pandemic era rates. Listings are the lowest they have been in recorded history, click here to read our recent report (or see below in our Listings section).
- That said, inventory levels are still not high enough to match demand so prices haven’t fallen as many were afraid and expecting to happen, though their rate of increase has substantially diminished. To learn more about inventory, click on the chart on the right.
- Last year was the beginning of the market decelerating and shifting away from the pandemic-era frenzy.
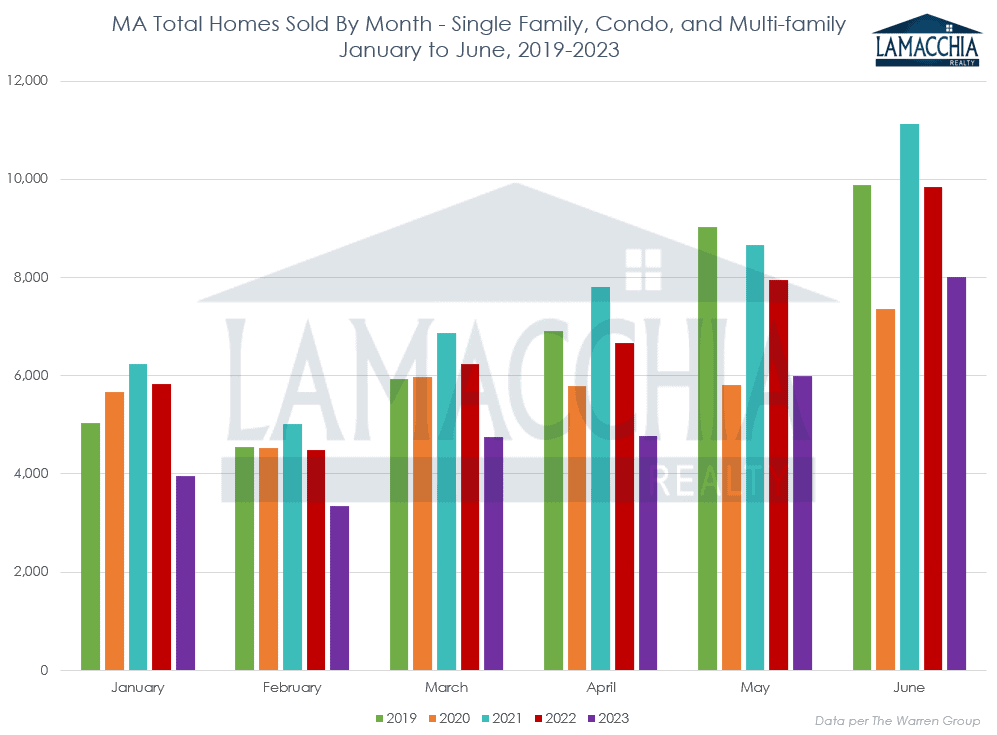
- Review the chart below, the red bars for 2022 are higher than 2023 in purple every month showing that sales were up last year over this year for the whole time period. The same phenomenon occurred in last year’s mid-year as 2021 was higher than 2022.
Prices Increase 1.7%
Prices increased in all the categories in the first half of 2023 over the same time period in 2022. The average price for all three categories is up to $680,385 over last year at this same time period which was at $669,271.
- Single family prices are up 0.9% to $702,656, condo prices are up 2.5% to $647,511, and multi-families are up 3.2% to $640,297.
- Average prices in Massachusetts have been steadily and at times rapidly rising for years but this is the first time in many where the price has adjusted nearly back to where it was this time last year, buyers rejoice!
- Inventory is beginning to rise back up to last year’s levels off and on, which is something we haven’t seen in years prior to January of 2023 and this is part of the reason why prices aren’t rising much. High demand and low supply makes housing a commodity, but if there are more houses than there are buyers, we may start to see the first hints of a more balanced market this year.
- Sellers are having to list their homes at competitive prices as they have to address that buyer affordability is at an all time low with prices still higher than they’ve ever been and rates roughly 2.5 times what they were during the pandemic.
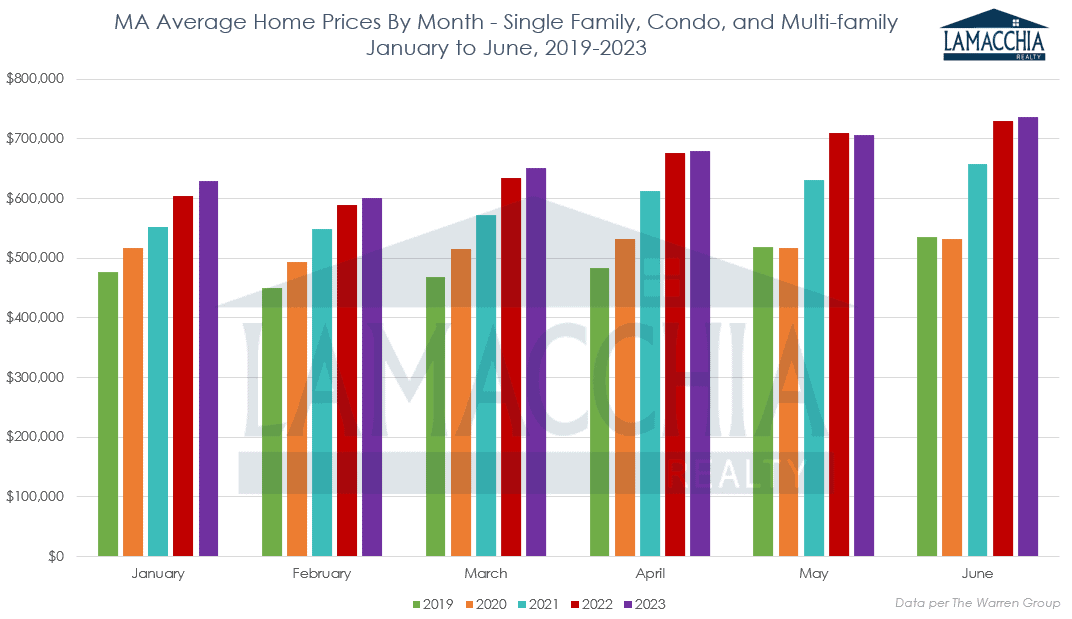
- In the chart below, you can see that over the past four years prices have steadily gained over prior years with this year being the first since before the pandemic to see only slight increases. Prior years had larger climbs in the first two quarters.
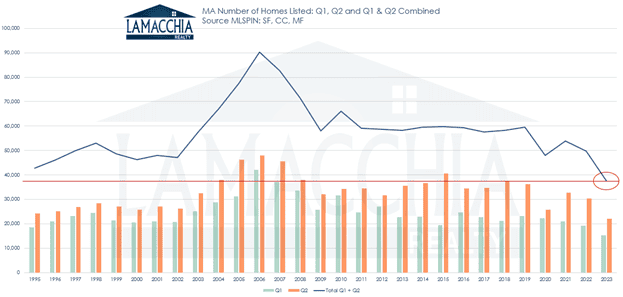
Homes Listed for Sale
There were 37,573 new active listings in the first half of 2023 compared to 49,762 last year, a 24.5% decrease.
- In April of this year we put out a Listings blog that covered how Q4 of 2022 exhibited the lowest number of homes listed out of any previous Q4 since records were kept. We recently published a report that covers the first half of 2023 which exhibited the least number of homes listed (for the full story click here) over a 6-month period (two consecutive quarters) since records have been kept (red line). This sure explains why every Realtor feels like business is so slow and why 2023 kicked off with very tight inventory.
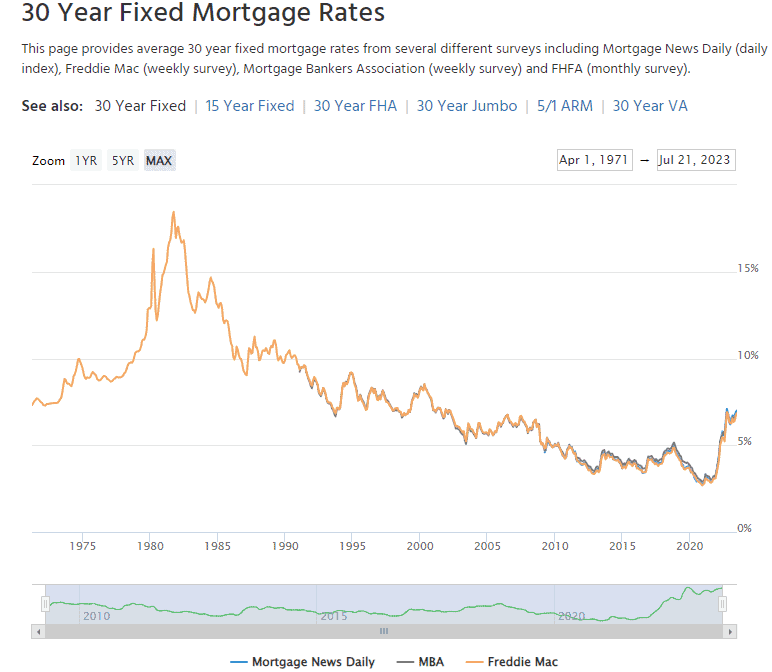
- A decrease in new listings shows that sellers fear losing their pandemic-era rate as low as 2 or 3% when they sell their home only to receive a current rate around 7% when they close on a new mortgage.
- In cases where interest rates pose a significant obstacle for buyers seeking more budget-friendly monthly payments, it’s worth considering various alternative options like mortgage buydowns or assumptions.
- New listings are an indicator of future pending sales, so with this number down we will likely see lower pending sales into the fall.
Pending Home Sales (contracts accepted)
The number of homes placed under contract declined 20.8% year over year with 33,560 pending sales over 42,383 last year this time.
- Listings are down and inventory is still historically low. Under this scenario, it’s to be expected that pending sales are also down year over year. Rates being high and giving buyers sticker shock are also not helping the case for pending sales.
- These rates as they currently are, in the 6-7% range, historically aren’t that high and will seem relatively normal as time goes on. The hope is that they don’t skyrocket but for the time being they are what they are. If a life change is propelling a seller to list and make a move, now is always better than later. Get the house, and if rates drop eventually and the equity position is in a good place, a refinance can always get that homeowner into a lower rate mortgage.
- Pandemic-era pending sales were astronomical during the frenzied market with the historically low rates, and more buyers than ever were competing over homes. It’s only natural in an adjusting market that pending sales decrease to try to find equilibrium.
- Pending sales are a future indicator of closed sales and with pendings down we are likely to continue to see a decrease in sales into the fall.
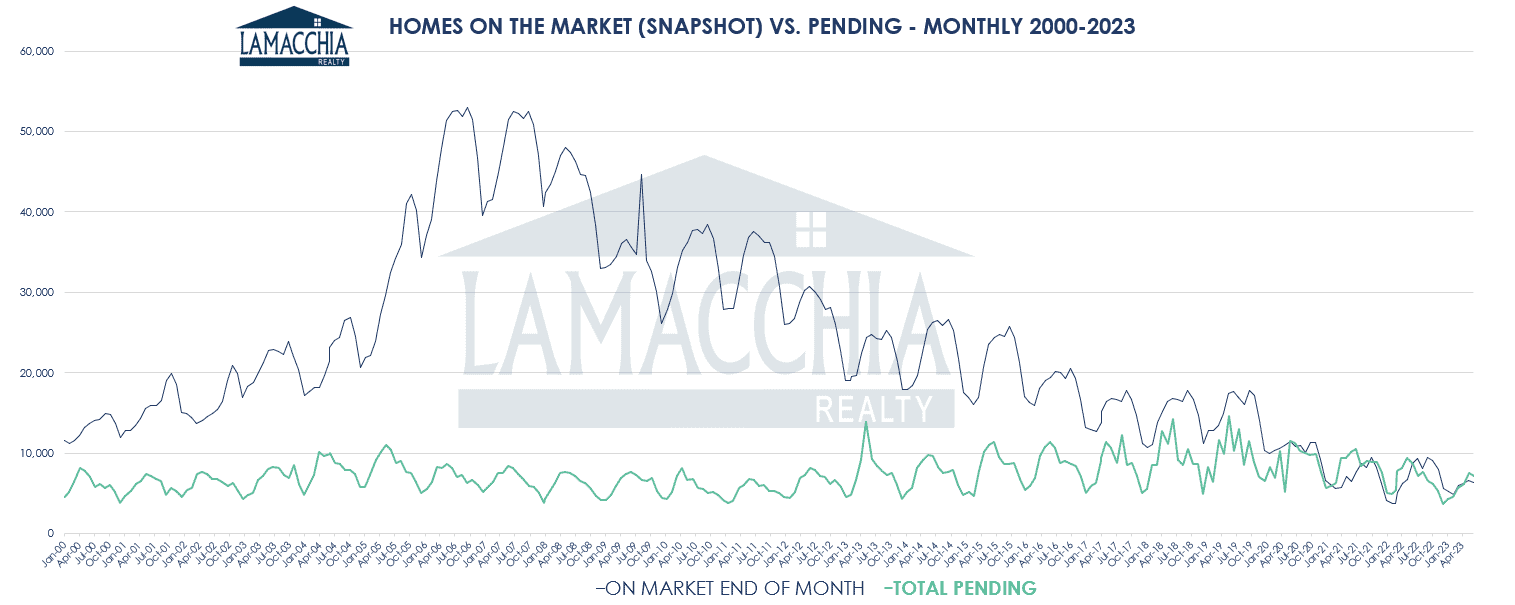
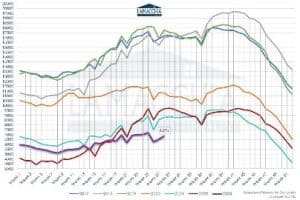
The chart above explains very clearly the story of the absorption rate phenomenon we experienced during the pandemic and post-pandemic frenzied market. Up until spring of 2020, the number of homes on the market (blue line) was above the number of homes with offers accepted (green line). You could also infer from this that the number of sellers (on market end of month) always outweighed the number of buyers (total pending). That changed in early 2020, when for the first time on record, buyers were as high if not higher (see spring of 2022) than sellers. The two lines have been competing against each other for the past few years indicating that supply is barely sufficient for demand.
It’s also very easy to see here that the market is in no way looking like the housing crash of 2008, when the number of sellers was astronomically higher than the number of buyers, and sellers had to compete with each other by lowering their prices to attract buyers. We aren’t seeing that yet as price changes are down year over year.
Predictions for the Rest of the Year
Similar to other New England states and the national trend, the Massachusetts real estate market has experienced a decrease in the number of sales accompanied by an increase (albeit slight) in prices.
This aligns with our previous predictions, but it is creating a strain on the available inventory. Many sellers are hesitant to list their properties because they secured low interest rates during the Covid era, making it challenging to accept the current rates, which are around 7% and we predict they will stay at this level for at least the next few months. We also expect that we are going to finish the year with the least amount of homes listed in recorded history.
Only when faced with necessity or significant life changes do sellers feel compelled to put their homes on the market. Events like divorces, growing families, relocations, and downsizing have influenced the market, but even these factors have not been sufficient to boost inventory to meet the demand adequately. Consequently, housing prices have, on average, continued to hold strong.
Buyers in the current real estate market are resolutely on the lookout for the ideal home that meets both their needs and budget. However, their budget has been affected by rising rates and prices, making affordability a key concern. Therefore, it is crucial for buyers to closely monitor interest rates and keep their pre-approvals up-to-date. By doing so, they can act swiftly and be ready to strike if an opportunity presents itself, especially if there is a drop in rates.
As we approach the middle of the year, sellers face a mix of favorable and challenging market conditions. Traditionally, the first half of the year is considered a seller’s market, which benefits those looking to sell their properties. However, as we move into the latter half of the year, the market tends to shift towards a buyer’s market, particularly for those who are simultaneously selling and buying. Despite this shift, it is still advantageous to list your property now.
Based on the current conditions of low inventory and steady prices, there is no anticipation of a housing price crash in the foreseeable future, if one were to occur at all. Anthony has likened this market to the situation in the 1980s, characterized by limited inventory and stable prices.
The advantages of homeownership outweigh the increasing costs because, ultimately, rents also tend to rise. Firstly, owning your own home, whether it’s a condo, single-family, or multi-family, grants you full control over your living space. It becomes entirely yours to customize and utilize as you wish. Secondly, homeownership offers the benefit of a fixed monthly payment, which leads to the third advantage of asset growth. With predictable monthly payments, you have the security of knowing what to expect, without the worry of sudden increases imposed by a landlord. Moreover, as you make those payments, you are building equity for yourself, not someone else. Lastly, in many instances, mortgage interest is tax deductible, allowing you to write off the interest you pay, this is particularly advantageous during the early stages of the loan when the interest portion of the payment is higher.
Data provided by Warren Group & MLS PIN then compared to the prior year.